
The SPI House Price Index Tracker plots the progress of the six most-watched house price indices in Spain, and brings them together in one chart. All the latest results showing data published last month are highlighted in yellow in the chart above.
The following residential property price indices were released in November (all figures show year-on-year percentage change):
- The Ministry of Public Works (Fomento) index based on valuations +2.7% in Q3 (September)
- The Association of Spanish Registrars +6.82% in Q3 (September)
- The Association of Spanish Notaries index +2.4% in September
- The Idealista asking price index +5.6% in November
- The Tinsa index based on valuations by the company +4.3% in October
The national indices don’t tell us anything about the direction of prices in local markets, but the do at least give us an idea of where we are in the property market cycle. Whereas a few years ago they were all in negative territory, they are all now in positive territory and pointing up, showing that the years of price adjustment are behind us. Indeed, the price data published in November was the most positive in more than a decade. If the current cycle performs like the past, we can expect several years of rising Spanish property prices ahead of us.
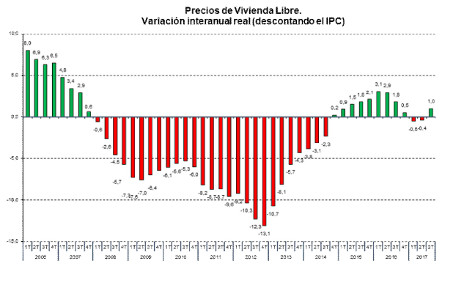
The following two charts from Fomento illustrate how prices have adjusted in the market cycle of the last twelve years. The first chart shows the nominal price change, and the second chart the real price change adjusted for inflation. Spanish house prices are growing again after eight years of declines, but the growth so far is timid.

The Tinsa index also shows house price changes broken down by type of area (see below). Whilst house prices around Spain rose 4.3% on average, they were up 6.4% in big cities and provincial capitals, by 5.1% in the Balearic and Canary islands, and by 0.9% on the Mediterranean coast. That said, Spanish house prices are still between 26% and 47% lower than they were at their peak in the last boom.
