The SPI House Price Index Tracker plots the progress of the six most-watched house price indices in Spain, and brings them together in one chart. All the latest results showing data published last month are highlighted in yellow in the chart above.
The following residential property price indices were released in September (all figures show year-on-year percentage change):
- The Association of Spanish Notaries index +0.3% in August
- The Tinsa index based on valuations by the company +3.2% in September
- The Idealista asking price index +3.2% in October
The national indices don’t tell us anything about prices in local markets, but the do at least give us an idea of where we are in the property market cycle. Whereas a few years ago they were all in negative territory, they are now broadly in positive territory, suggesting that the years of price adjustment are behind us. If the current cycle performs like the past, we can expect several years of rising Spanish property prices ahead of us.
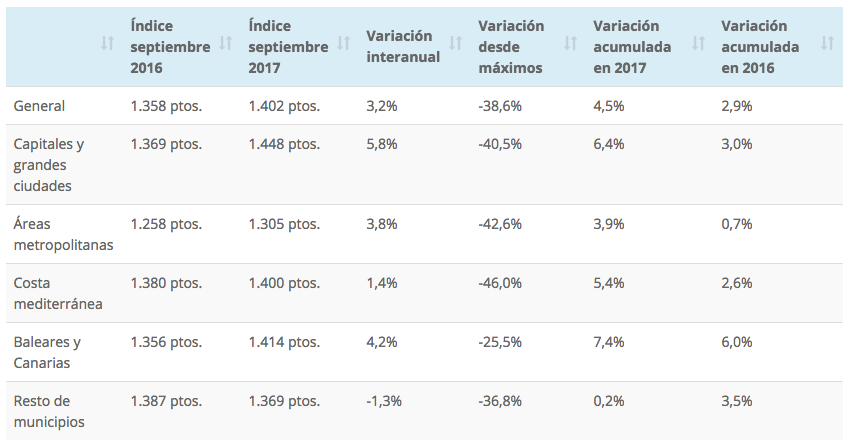
The Tinsa index also shows house price changes broken down by type of area (see below). Whilst house prices around Spain rose 3.2% on average, they were up 5.8% in big cities and provincial capitals, by 4.2% in the Balearic and Canary islands, and by 1.4% on the Mediterranean coast.