
Every month the SPI House Price Index Tracker plots the progress of the six most-watched house price indices in Spain, and puts them all on one page.
All four indices published in February were positive, and showed average house prices rising by between 0.9% and 5.67% (highlighted in yellow above).
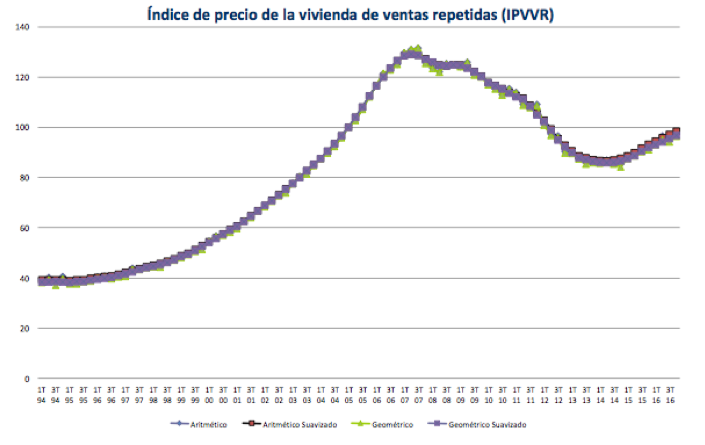
The Association of Spanish Land Registrars published their end-of-year report with their house price index (+5.67%) based on their repeat sales methodology that only counts homes that have sold twice in the period of study. This is probably the most accurate guide to prices in the most liquid part of the market – the homes that change hands most often – but leaves out all those homes that have sold for the first time (like many bank repos), and says nothing about the value of homes that can’t find a buyer.
The next chart, prepared by the registrars, illustrates the curve of Spanish house prices through boom and bust, and towards recovery, all according to their data and methodology.
The registrars also provide a chart showing how house prices have changed in annualised terms each quarter since 1995. Prices fell substantially between 2008 and 2013, and have been on positive or on an upward curve ever since.

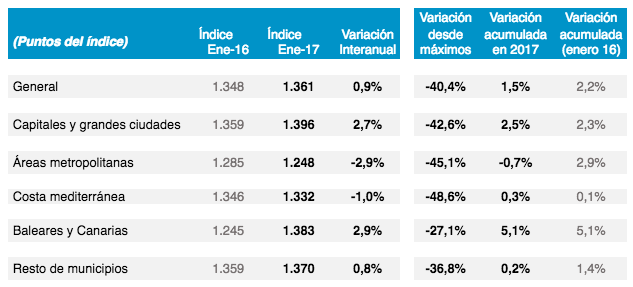
The Tinsa index (+0.9%) also comes broken down by type of area (see below). The Mediterranean coast was down 1%, whilst the islands were up 2.9%.
As I always point out, these national house price figures are not much use to buyers and vendors who want to know what is going on in their local market segments, as these can vary substantially from the national picture. The headline figures for average prices do, however, get media attention in Spain, and might influence expectations.