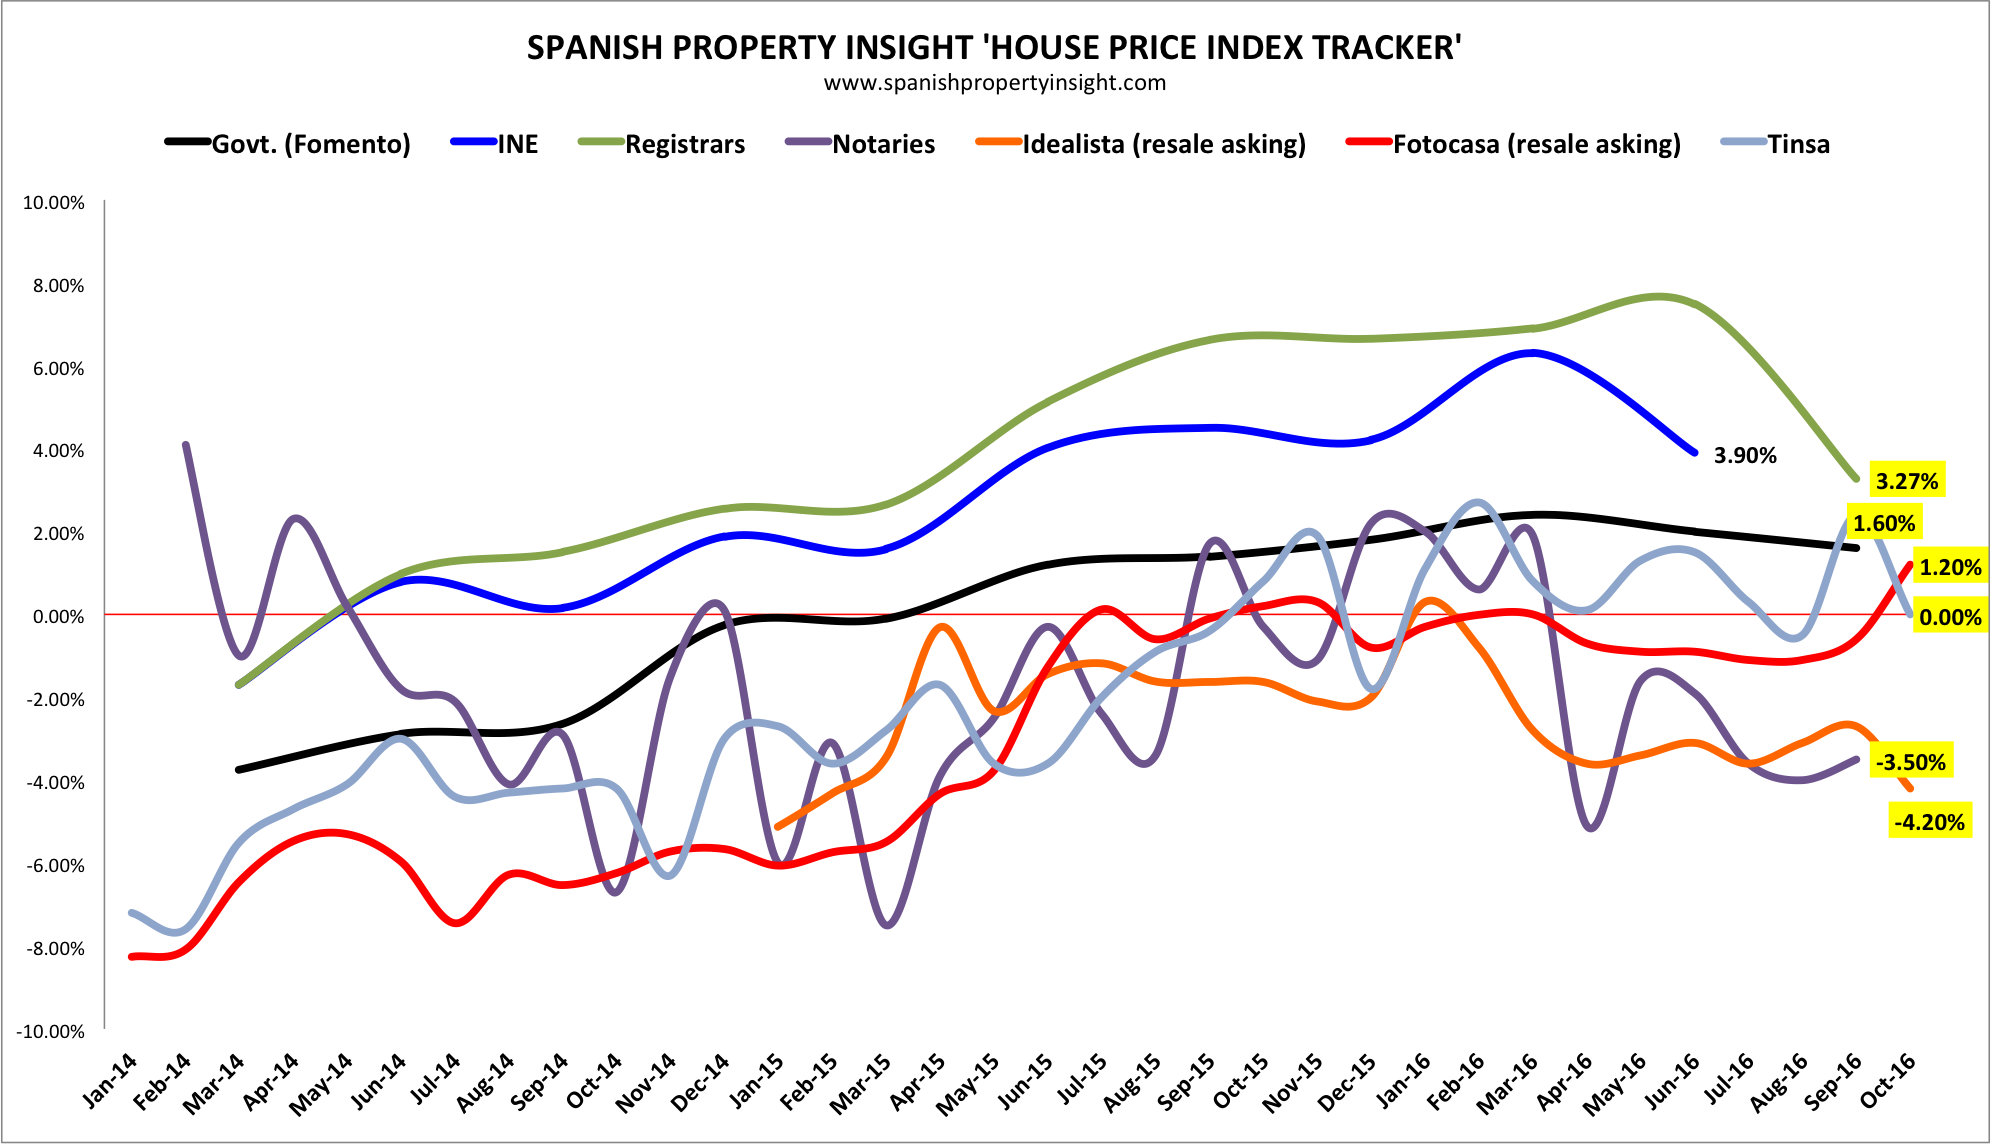
Every month the SPI House Price Index Tracker plots the progress of the seven most-watched house price indices in Spain, and puts them all on one page.
All but one of them published data in November, highlighted in yellow in the chart above.
As I always point out, the national figures are not much use to buyers and sellers who want to know what is going on in their local market segments, which can vary substantially from the national picture. They do, however, get media attention in Spain, and might influence expectations.
It looks like the upward trend over the last few years has lost momentum in 2016, with most of the indices running out of steam as the year went on.
The Idealista resale asking price index is now the most negative (-4.2%) followed by the index published by the notaries based on sales prices. The only one showing some upward momentum was the resale asking price index published by the property portal Fotocasa, and I wouldn’t read much into that.
According to the index published by the Spanish Land Registrars Association (Registradores), average Spanish house prices are still 28% below their peak, but have risen 9% since bottoming out.
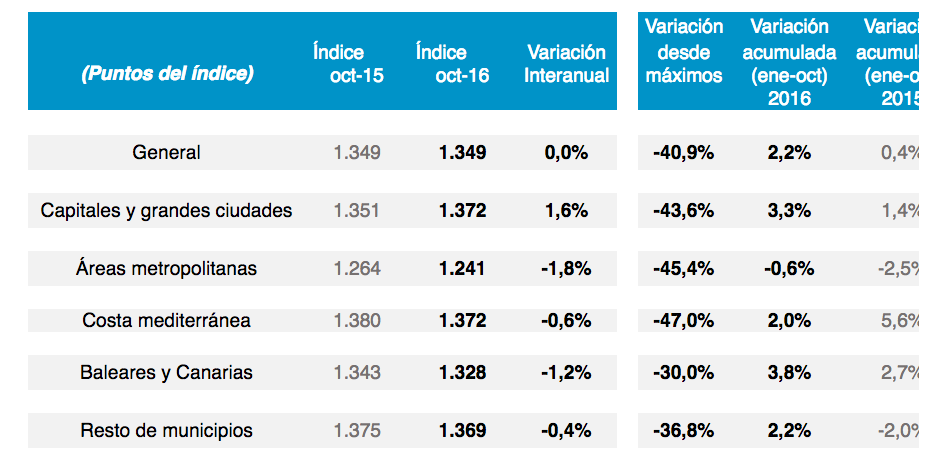
As usual the Tinsa index, based on valuations, comes with a breakdown by type of area (see below). The overall index was unchanged, but the coast was down 0.6%, and the islands down 1.2%.