The British market for residential property in Spain, analysed in data tables and interactive charts using data from all the main public sources and updated regularly. How many homes to the British buy in Spain?, where do they buy? and how much do they spend? are just some of the questions answered by this data.
Use the ‘show entries’ option to display the number of periods or records you want. ‘All’ will show all the periods in the data set. Use the table headings, especially of the first column on the left to organise / toggle the data as ascending or descending (default position is descending so you see the latest results at the top of the table). Use the filter field under the first column to focus on a period or series in that column. For example, type ‘Q’ just to see quarters, ‘M’ for months, or ‘Y’ for years. Type ‘202’ to see all periods this decade, or ‘2021’ just for the year 2021. The table will automatically update to reflect your filter parameter, and any charts associated with the table will update according to your filter. And if you see a ‘Columns’ button you can use that to toggle columns > click on the button to show/hide columns. P.S. if you ever see FNR that means Foreign Non-Residents.
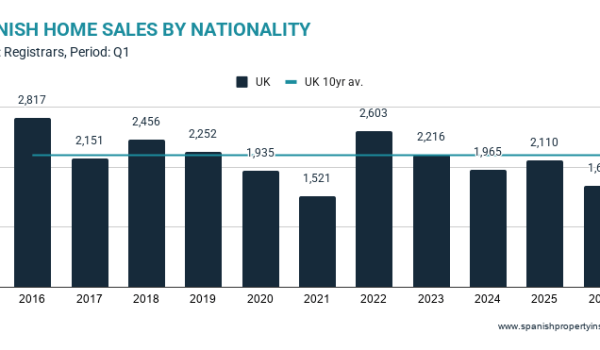
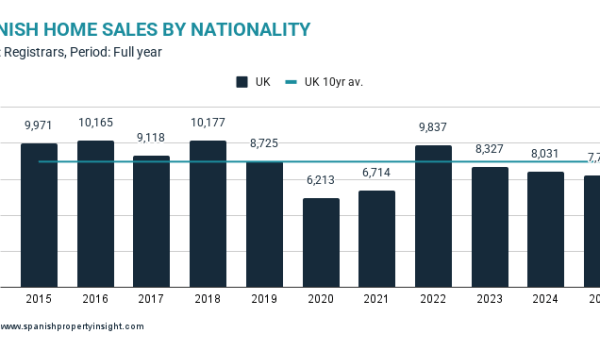
British / UK market (SQL id 234)
This table shows the number of Spanish homes purchased by BRITISH buyers using data from the notaries · FMS = foreign market share · FNR = foreign non-resident buyer · FNR FMS = percentage of the FNR market segment · % FNR shows what percentage of buyers were non-residents (buying second-homes and investments) · Charts may look disjointed until the table is filtered.
| date | PERIOD | UK | UK YoY | UK FMS | Index | FNR | FNR YoY | FNR FMS | % FNR | Expat | Expat YoY | Expat FMS | % Expat | Total €/sqm | FNR €/sqm | Expat €/sqm |
|---|---|---|---|---|---|---|---|---|---|---|---|---|---|---|---|---|
| 2007-06-15 | 2007-H1 | 10,723 | 32.4 | 107 | 8,256 | 63.5 | 77.0 | 2,467 | 12.3 | 23.0 | 1,912 | 2,152 | 1,404 | |||
| 2007-12-15 | 2007-H2 | 9,158 | 37.3 | 92 | 7,038 | 60.8 | 76.9 | 2,120 | 16.4 | 23.2 | 2,102 | 2,242 | 1,729 | |||
| 2007-12-16 | 2007-Y | 19,881 | 34.5 | 100 | 15,294 | 62.3 | 76.9 | 4,587 | 13.9 | 23.1 | 2,007 | 2,197 | 1,567 | |||
| 2008-06-15 | 2008-H1 | 6,833 | -36.3 | 37.9 | 68 | 5,207 | -36.9 | 53.5 | 76.2 | 1,626 | -34.1 | 19.6 | 23.8 | 2,183 | 2,290 | 1,873 |
| 2008-12-15 | 2008-H2 | 4,944 | -46.0 | 29.7 | 49 | 3,764 | -46.5 | 47.6 | 76.1 | 1,180 | -44.3 | 13.5 | 23.9 | 2,061 | 2,156 | 1,786 |
| 2008-12-16 | 2008-Y | 11,777 | -40.8 | 33.9 | 59 | 8,971 | -41.3 | 50.8 | 76.2 | 2,806 | -38.8 | 16.4 | 23.8 | 2,122 | 2,223 | 1,830 |
| 2009-06-15 | 2009-H1 | 3,344 | -51.1 | 17.2 | 33 | 2,199 | -57.8 | 34.6 | 65.8 | 1,145 | -29.6 | 8.8 | 34.2 | 1,804 | 1,908 | 1,613 |
| 2009-12-15 | 2009-H2 | 3,869 | -21.7 | 18.7 | 38 | 2,582 | -31.4 | 33.7 | 66.7 | 1,287 | 9.1 | 9.9 | 33.3 | 1,901 | 2,016 | 1,689 |
| 2009-12-16 | 2009-Y | 7,213 | -38.8 | 18.0 | 36 | 4,781 | -46.7 | 34.1 | 66.3 | 2,432 | -13.3 | 9.3 | 33.7 | 1,853 | 1,962 | 1,651 |
| 2010-06-15 | 2010-H1 | 3,506 | 4.8 | 17.2 | 35 | 2,134 | -3.0 | 26.7 | 60.9 | 1,372 | 19.8 | 11.1 | 39.1 | 1,822 | 1,927 | 1,669 |
| 2010-12-15 | 2010-H2 | 3,213 | -17.0 | 17.0 | 32 | 1,924 | -25.5 | 25.9 | 59.9 | 1,289 | 0.2 | 11.3 | 40.1 | 1,706 | 1,770 | 1,617 |
| 2010-12-16 | 2010-Y | 6,719 | -6.9 | 17.1 | 33 | 4,058 | -15.1 | 26.3 | 60.4 | 2,661 | 9.4 | 11.2 | 39.6 | 1,764 | 1,849 | 1,643 |
| 2011-06-15 | 2011-H1 | 3,163 | -9.8 | 16.6 | 31 | 1,945 | -8.9 | 22.1 | 61.5 | 1,218 | -11.2 | 11.9 | 38.5 | 1,763 | 1,792 | 1,717 |
| 2011-12-15 | 2011-H2 | 3,158 | -1.7 | 15.3 | 31 | 1,935 | 0.6 | 19.9 | 61.3 | 1,223 | -5.1 | 11.3 | 38.7 | 1,602 | 1,682 | 1,477 |
| 2011-12-16 | 2011-Y | 6,321 | -5.9 | 15.9 | 31 | 3,880 | -4.4 | 20.9 | 61.4 | 2,441 | -8.3 | 11.6 | 38.6 | 1,683 | 1,737 | 1,597 |
| 2012-06-15 | 2012-H1 | 3,016 | -4.7 | 14.0 | 30 | 1,776 | -8.7 | 17.7 | 58.9 | 1,240 | 1.8 | 10.8 | 41.1 | 1,542 | 1,601 | 1,454 |
| 2012-12-15 | 2012-H2 | 4,119 | 30.4 | 14.3 | 41 | 2,711 | 40.1 | 17.6 | 65.8 | 1,408 | 15.1 | 10.6 | 34.2 | 1,486 | 1,509 | 1,442 |
| 2012-12-16 | 2012-Y | 7,135 | 12.9 | 14.2 | 35 | 4,487 | 15.6 | 17.6 | 62.9 | 2,648 | 8.5 | 10.7 | 37.1 | 1,514 | 1,555 | 1,448 |
| 2013-06-15 | 2013-H1 | 3,662 | 21.4 | 14.7 | 36 | 2,089 | 17.6 | 15.7 | 57.1 | 1,573 | 26.9 | 13.7 | 43.0 | 1,635 | 1,435 | 1,951 |
| 2013-12-15 | 2013-H2 | 4,530 | 10.0 | 15.3 | 45 | 2,934 | 8.2 | 17.6 | 64.8 | 1,596 | 13.4 | 12.3 | 35.2 | 1,474 | 1,544 | 1,332 |
| 2013-12-16 | 2013-Y | 8,192 | 14.8 | 15.0 | 41 | 5,023 | 12.0 | 16.7 | 61.3 | 3,169 | 19.7 | 12.9 | 38.7 | 1,555 | 1,490 | 1,642 |
| 2014-06-15 | 2014-H1 | 5,077 | 38.6 | 15.5 | 51 | 3,381 | 61.9 | 19.1 | 66.6 | 1,696 | 7.8 | 11.2 | 33.4 | 1,480 | 1,522 | 1,395 |
| 2014-12-15 | 2014-H2 | 6,430 | 41.9 | 18.3 | 64 | 4,455 | 51.8 | 23.5 | 69.3 | 1,975 | 23.8 | 12.1 | 30.7 | 1,478 | 1,531 | 1,361 |
| 2014-12-16 | 2014-Y | 11,507 | 40.5 | 16.9 | 57 | 7,836 | 56.0 | 21.4 | 68.1 | 3,671 | 15.8 | 11.7 | 31.9 | 1,479 | 1,527 | 1,378 |
| 2015-06-15 | 2015-H1 | 7,159 | 41.0 | 19.7 | 72 | 4,999 | 47.9 | 26.9 | 69.8 | 2,160 | 27.4 | 12.1 | 30.2 | 1,525 | 1,549 | 1,469 |
| 2015-12-15 | 2015-H2 | 8,800 | 36.9 | 21.6 | 88 | 6,413 | 44.0 | 30.1 | 72.9 | 2,387 | 20.9 | 12.3 | 27.1 | 1,566 | 1,628 | 1,407 |
| 2015-12-16 | 2015-Y | 15,959 | 38.7 | 20.7 | 80 | 11,412 | 45.6 | 28.6 | 71.5 | 4,547 | 23.9 | 12.2 | 28.5 | 1,546 | 1,589 | 1,438 |
| 2016-06-15 | 2016-H1 | 8,173 | 14.2 | 18.5 | 82 | 5,900 | 18.0 | 26.6 | 72.2 | 2,273 | 5.2 | 10.3 | 27.8 | 1,520 | 1,554 | 1,444 |
| 2016-12-15 | 2016-H2 | 6,574 | -25.3 | 15.1 | 66 | 4,632 | -27.8 | 21.7 | 70.5 | 1,942 | -18.6 | 8.8 | 29.5 | 1,524 | 1,573 | 1,415 |
| 2016-12-16 | 2016-Y | 14,747 | -7.6 | 16.8 | 74 | 10,532 | -7.7 | 24.2 | 71.4 | 4,215 | -7.3 | 9.6 | 28.6 | 1,522 | 1,564 | 1,430 |
| 2017-06-15 | 2017-H1 | 6,823 | -16.5 | 13.5 | 68 | 4,646 | -21.3 | 19.7 | 68.1 | 2,177 | -4.2 | 8.1 | 31.9 | 1,583 | 1,658 | 1,435 |
| 2017-12-15 | 2017-H2 | 7,084 | 7.8 | 14.3 | 71 | 4,912 | 6.0 | 21.1 | 69.3 | 2,172 | 11.8 | 8.3 | 30.7 | 1,622 | 1,709 | 1,444 |
| 2017-12-16 | 2017-Y | 13,907 | -5.7 | 13.9 | 70 | 9,558 | -9.3 | 20.4 | 68.7 | 4,349 | 3.2 | 8.2 | 31.3 | 1,603 | 1,684 | 1,440 |
| 2018-06-15 | 2018-H1 | 7,450 | 9.2 | 13.9 | 74 | 4,998 | 7.6 | 21.3 | 67.1 | 2,452 | 12.6 | 8.2 | 32.9 | 1,619 | 1,711 | 1,440 |
| 2018-12-15 | 2018-H2 | 7,524 | 6.2 | 15.0 | 75 | 5,275 | 7.4 | 23.9 | 70.1 | 2,249 | 3.6 | 8.0 | 29.9 | 1,639 | 1,701 | 1,504 |
| 2018-12-16 | 2018-Y | 14,974 | 7.7 | 14.4 | 75 | 10,273 | 7.5 | 22.5 | 68.6 | 4,701 | 8.1 | 8.1 | 31.4 | 1,629 | 1,706 | 1,472 |
| 2019-06-15 | 2019-H1 | 6,525 | -12.4 | 12.6 | 65 | 4,180 | -16.4 | 19.7 | 64.1 | 2,345 | -4.4 | 7.7 | 35.9 | 1,646 | 1,727 | 1,503 |
| 2019-12-15 | 2019-H2 | 6,525 | -13.3 | 12.9 | 65 | 4,286 | -18.8 | 20.1 | 65.7 | 2,239 | -0.4 | 7.7 | 34.3 | 1,747 | 1,839 | 1,568 |
| 2019-12-16 | 2019-Y | 13,050 | -12.9 | 12.8 | 65 | 8,466 | -17.6 | 19.9 | 64.9 | 4,584 | -2.5 | 7.7 | 35.1 | 1,697 | 1,783 | 1,536 |
| 2020-06-15 | 2020-H1 | 3,804 | -41.7 | 11.7 | 38 | 2,307 | -44.8 | 19.0 | 60.7 | 1,497 | -36.2 | 7.4 | 39.4 | 1,854 | 2,027 | 1,574 |
| 2020-12-15 | 2020-H2 | 5,719 | -12.4 | 12.7 | 57 | 3,486 | -18.7 | 19.8 | 61.0 | 2,233 | -0.3 | 8.1 | 39.1 | 1,711 | 1,855 | 1,474 |
| 2020-12-16 | 2020-Y | 9,523 | -27.0 | 12.3 | 47 | 5,793 | -31.6 | 19.5 | 60.8 | 3,730 | -18.6 | 7.8 | 39.2 | 1,783 | 1,941 | 1,524 |
| 2021-06-15 | 2021-H1 | 4,499 | 18.3 | 9.4 | 45 | 2,192 | -5.0 | 13.5 | 48.7 | 2,307 | 54.1 | 7.3 | 51.3 | 1,796 | 2,031 | 1,570 |
| 2021-12-15 | 2021-H2 | 7,379 | 29.0 | 11.5 | 74 | 4,576 | 31.3 | 15.8 | 62.0 | 2,803 | 25.5 | 8.0 | 38.0 | 1,959 | 2,186 | 1,605 |
| 2021-12-16 | 2021-Y | 11,878 | 24.7 | 10.6 | 59 | 6,768 | 16.8 | 15.0 | 57.0 | 5,110 | 37.0 | 7.7 | 43.0 | 1,878 | 2,109 | 1,588 |
| 2022-06-15 | 2022-H1 | 7,626 | 69.5 | 10.4 | 76 | 4,685 | 113.7 | 14.0 | 61.4 | 2,941 | 27.5 | 7.4 | 38.6 | 1,996 | 2,162 | 1,742 |
| 2022-12-15 | 2022-H2 | 7,303 | -1.0 | 10.4 | 73 | 4,505 | -1.6 | 14.2 | 61.7 | 2,798 | -0.2 | 7.2 | 38.3 | 2,080 | 2,238 | 1,826 |
| 2022-12-16 | 2022-Y | 14,929 | 25.7 | 10.4 | 75 | 9,190 | 35.8 | 14.1 | 61.6 | 5,739 | 12.3 | 7.3 | 38.4 | 2,038 | 2,200 | 1,784 |
| 2023-06-15 | 2023-H1 | 6,315 | -17.2 | 9.3 | 63 | 3,676 | -21.5 | 12.4 | 58.2 | 2,639 | -10.3 | 6.8 | 41.8 | 2,069 | 2,274 | 1,775 |
| 2023-12-15 | 2023-H2 | 6,155 | -15.7 | 9.7 | 61 | 3,730 | -17.2 | 13.8 | 60.6 | 2,425 | -13.3 | 6.7 | 39.4 | 2,165 | 2,408 | 1,796 |
| 2023-12-16 | 2023-Y | 12,470 | -16.5 | 9.5 | 62 | 7,406 | -19.4 | 13.1 | 59.4 | 5,064 | -11.8 | 6.8 | 40.6 | 2,117 | 2,341 | 1,786 |
| 2024-06-15 | 2024-H1 | 5,864 | -7.1 | 8.5 | 59 | 3,480 | -5.3 | 12.0 | 59.4 | 2,384 | -9.7 | 5.9 | 40.7 | 2,271 | 2,491 | 1,939 |
| 2024-12-15 | 2024-H2 | 6,048 | -1.7 | 8.7 | 60 | 3,681 | -1.3 | 12.6 | 60.9 | 2,367 | -2.4 | 5.9 | 39.1 | 2,417 | 2,719 | 1,933 |
| 2024-12-16 | 2024-Y | 11,912 | -4.5 | 8.6 | 59 | 7,161 | -3.3 | 12.3 | 60.1 | 4,751 | -6.2 | 5.9 | 39.9 | 2,344 | 2,605 | 1,936 |
| 2025-06-15 | 2025-H1 | 5,747 | -2.0 | 8.0 | 57 | 3,296 | -5.3 | 11.8 | 57.4 | 2,451 | 2.8 | 5.6 | 42.7 | 2,482 | 2,795 | 2,058 |
| 2025-12-15 | 2025-H2 | 5,178 | -14.4 | 7.8 | 52 | 2,856 | -22.4 | 11.5 | 55.2 | 2,322 | -1.9 | 5.6 | 44.8 | 2,627 | 2,952 | 2,215 |
| 2025-12-16 | 2025-Y | 10,925 | -8.3 | 7.9 | 55 | 6,152 | -14.1 | 11.7 | 56.3 | 4,773 | 0.5 | 5.6 | 43.7 | 2,555 | 2,874 | 1,996 |
| date | PERIOD |
Sales by region to British buyers (SQL id 343)
Number of Spanish homes purchased by this nationality each year in the most popular regions. Only includes regions where they are in the top ten by nationality, so a significant number of sales might not be included here. Data from the registrars.
| PERIOD | REGION | Sales |
|---|---|---|
| 2021-Y | ANDALUSIA | 2,250 |
| 2022-Y | ANDALUSIA | 3,272 |
| 2023-Y | ANDALUSIA | 2,687 |
| 2024-Y | ANDALUSIA | 2,490 |
| 2021-Y | ASTURIAS | 8 |
| 2022-Y | ASTURIAS | 16 |
| 2023-Y | ASTURIAS | 21 |
| 2024-Y | ASTURIAS | 26 |
| 2021-Y | BALEARICS | 534 |
| 2022-Y | BALEARICS | 640 |
| 2023-Y | BALEARICS | 452 |
| 2024-Y | BALEARICS | 435 |
| 2021-Y | CANARIES | 690 |
| 2022-Y | CANARIES | 1,028 |
| 2023-Y | CANARIES | 707 |
| 2024-Y | CANARIES | 633 |
| 2021-Y | CANTABRIA | 8 |
| 2022-Y | CANTABRIA | 7 |
| 2023-Y | CANTABRIA | 8 |
| 2024-Y | CANTABRIA | 8 |
| 2021-Y | CATALONIA | 239 |
| 2022-Y | CATALONIA | 353 |
| 2024-Y | CATALONIA | 337 |
| 2021-Y | VALENCIAN C. | 2,051 |
| 2022-Y | VALENCIAN C. | 2,968 |
| 2023-Y | VALENCIAN C. | 2,693 |
| 2024-Y | VALENCIAN C. | 2,700 |
| 2022-Y | EXTREMADURA | 3 |
| 2021-Y | GALICIA | 7 |
| 2022-Y | GALICIA | 10 |
| 2023-Y | GALICIA | 10 |
| 2024-Y | GALICIA | 17 |
| 2021-Y | MADRID | 88 |
| 2022-Y | MADRID | 99 |
| 2024-Y | MADRID | 135 |
| 2021-Y | MURCIA | 860 |
| 2022-Y | MURCIA | 1,213 |
| 2023-Y | MURCIA | 1,269 |
| 2024-Y | MURCIA | 1,266 |
| 2021-Y | BASQUE C. | 15 |
| 2022-Y | LA RIOJA | 7 |
| 2024-Y | LA RIOJA | 7 |
| PERIOD | REGION |