
The SPI House Price Index Tracker plots the progress of the six most-watched house price indices in Spain, and brings them together in the chart above.
The following residential property price indices were updated in Q3 2018 (all figures show latest year-on-year percentage change):
- The Ministry of Public Works (Fomento) +3.8% in the second quarter, based on official valuations
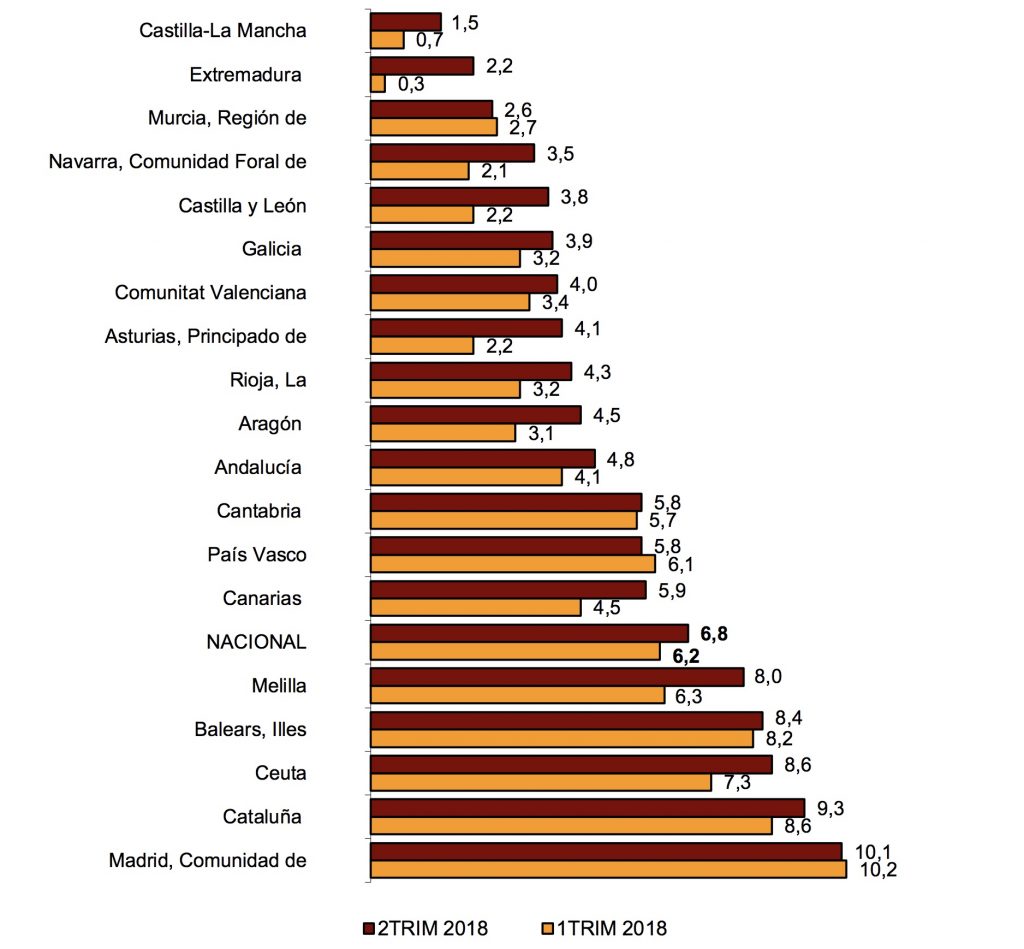
- The National Institute of Statistics (INE) index +6.8% in the second quarter
- The Spanish Land Registrars’ Association +10.68 in the second quarter
- The Association of Spanish Notaries index -4.5% in July
- The Idealista.com (property portal) resale asking price index +9.2% in August
- The Tinsa index based on property valuations carried out by the company +5.6% in August
As I always point out, these national indices don’t tell us anything about local markets, but they do give us some idea of where we are in the property market cycle. With the exception of the volatile index published by the notaries, which seems to go up and down like a yoyo, all of the main indices now show Spanish house prices as rising in what looks like a well-established recovery.
Spanish house price changes by region / area
The INE publish regional house prices changes in the last two quarters, as illustrated by the following chart showing the hottest markets as Madrid, Catalonia, and the Balearics.
The Spanish house price index published by Tinsa – one of Spain’s biggest appraisal companies – also shows house price changes by area, with the big cities (mainly Barcelona and Madrid) up 9.8% in May, the Mediterranean coast up 4,8%, and the Balearic and Canary Islands up 9.2%.
